Forex Support and resistance
Support and resistance are fundamental concepts in forex trading that help traders analyze price movements, make informed decisions, and develop trading strategies. They represent key levels on a price chart where the price tends to react or reverse. Here’s an overview of the support and resistance trading strategy:
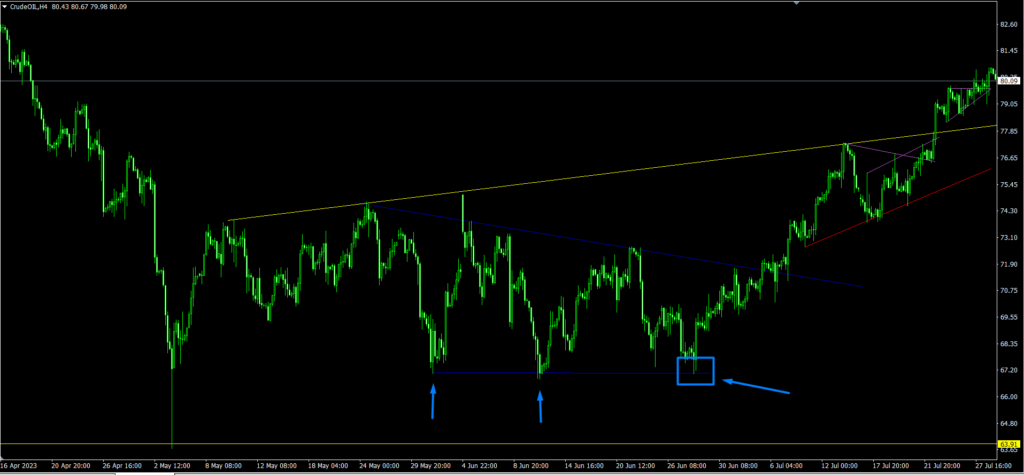
Support Level: Support is a price level where a currency pair tends to stop falling and may reverse its direction. It’s a level at which buying interest is strong enough to overcome selling pressure. Traders often draw a horizontal line on the chart to identify support levels.
Examples of support level:
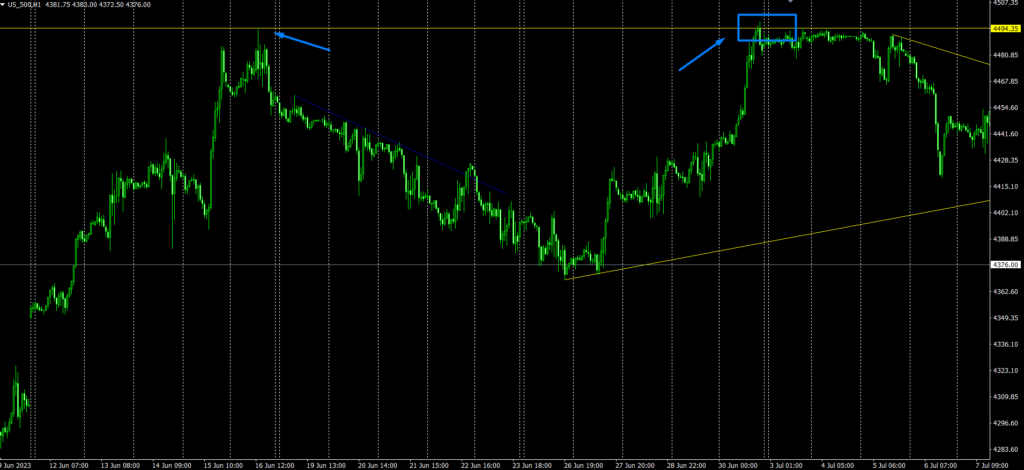
Resistance Level: Resistance is a price level where a currency pair tends to stop rising and may reverse. It’s a level at which selling interest is strong enough to overcome buying pressure. Resistance levels are also marked with horizontal lines on the chart.
Examples of resistance level:
Identification of Support and Resistance: Traders use various methods to identify support and resistance levels. These include:
Swing Highs and Lows:
Points where price reverses its direction.
Psychological Levels: Round numbers (e.g., 1.1000) that often act as support or resistance.
Moving Averages: Prices often react at or near moving average lines.
Trendlines: Diagonal lines drawn along the trend that can act as dynamic support or resistance.
Pivot Points: Calculated levels based on previous day’s high, low, and close prices.
Role Reversal: Once a support level is breached, it may turn into a resistance level, and vice versa. Traders look for these role reversal points to anticipate potential price reactions.
Trading Strategies:
Bounce Strategy: Traders enter buy orders near support and sell orders near resistance, expecting price to reverse.
Breakout Strategy: Traders enter buy orders above resistance or sell orders below support, anticipating a significant price movement.
Consolidation: When price moves within a range between support and resistance, traders may buy near support and sell near resistance until a breakout occurs.
Confirmation: Traders often use additional technical analysis tools, such as candlestick patterns, trendlines, and technical indicators, to confirm potential support or resistance levels before making a trade.
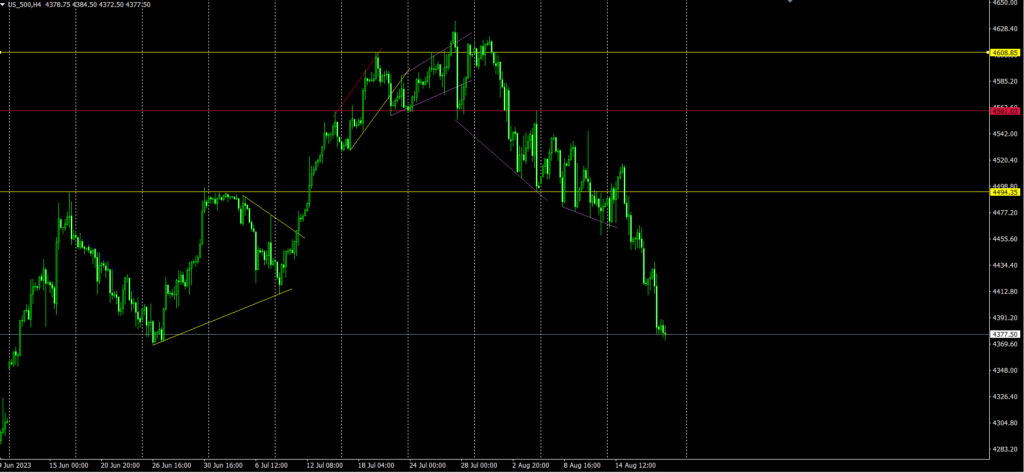
Examples of trendlines:
Risk Management:
Place stop-loss orders below support or above resistance to manage risk in case the price breaks through these levels. Traders can also use trailing stops to lock in profits as the price moves in their favor.
Timeframes: Support and resistance levels can be identified on various timeframes. Long-term levels (found on higher timeframes) may have a stronger impact than short-term levels.
Market Context: Consider the broader market context, including trends and upcoming economic events, when analyzing support and resistance levels.
Practice and Experience: Identifying reliable support and resistance levels requires practice and experience. Not all levels are equally strong, and false breakouts can occur.
Remember,
support and resistance levels are not exact prices, but rather zones where price tends to react. They are valuable tools to enhance decision-making and risk management in forex trading. Always combine support and resistance analysis with other technical and fundamental factors for a comprehensive trading strategy.
For more insights and educational content on commodities trading, visit ForexGoodBlog. Explore the world of crude oil trading and embark on a journey towards financial success in the commodities market.
Remember trading is not suitable for everyone, all the material here is for study only, trading is dangerous and can cause losses.
To learn more come to learn.