Hammer Candlestick Pattern:
In forex trading, a “hammer” is a single candlestick pattern that is often considered a potential reversal signal when it appears at the end of a downtrend. The hammer pattern is characterized by its distinctive shape, resembling a hammer, and it can provide valuable insights into market sentiment and potential price reversals. Here’s what you need to know about the hammer candlestick pattern:
Hammer Candlestick Pattern:
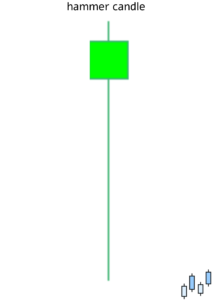
Characteristics of a Hammer:
Small Real Body: The hammer has a small real body (the rectangular part of the candlestick), which is typically located near the top of the candle’s trading range.
Long Lower Shadow: The most crucial feature of a hammer is its long lower shadow, which extends well below the body of the candle. This long lower shadow represents the price rejection or the attempt by sellers to push the price lower during the trading period.
Short or Nonexistent Upper Shadow: Ideally, a hammer should have little to no upper shadow, indicating that the bulls have taken control at the end of the session.
Interpretation of a Hammer:
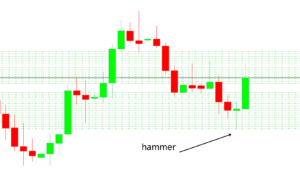
When a hammer appears on the price chart, it suggests a potential reversal of the current downtrend. Here’s how traders typically interpret a hammer:
The small real body near the top of the candle indicates that buyers are starting to gain control.
The long lower shadow signifies that sellers attempted to drive the price lower but were unsuccessful, and buyers stepped in, pushing the price back up.
The appearance of a hammer after a downtrend may signal that selling pressure is diminishing, and a bullish reversal or at least a significant bounce could occur.
While the hammer is a potentially bullish signal, traders often look for confirmation in the form of a bullish candle or price movement in the next period to increase the reliability of the reversal signal.
Stop-loss orders are usually placed just below the low of the hammer candle to manage risk in case the reversal doesn’t materialize.
It’s important to note that while the hammer pattern can be a powerful signal, it is not foolproof, and trading always involves risk. Traders should use proper risk management techniques, consider other technical and fundamental factors, and, if possible, combine the hammer pattern with other confirmation signals before making trading decisions.
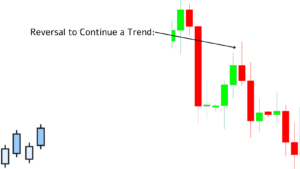
Now, let’s discuss the concept of a “reversal to continue a trend” in forex trading.
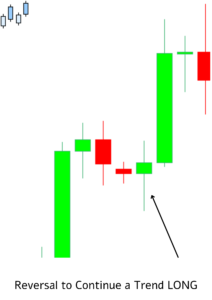
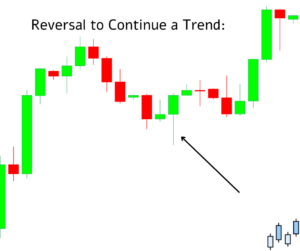
Reversal to Continue a Trend:
In forex trading, a “reversal to continue a trend” refers to a situation where a price reversal occurs temporarily, but the overall trend continues after the reversal. This pattern often happens within the context of a broader trend and can provide trading opportunities for those who can identify and capitalize on it.
Key Points:
Distinguishing Between Reversal and Trend Continuation: Traders need to distinguish between a true trend reversal and a temporary pullback or correction within the larger trend. This can be challenging but is essential for making informed trading decisions.
Identifying Support and Resistance Levels: Support and resistance levels play a crucial role in recognizing potential reversal points and trend continuation. Traders often use technical analysis tools, such as trendlines, moving averages, and Fibonacci retracement levels, to identify these key levels.
Hammer Candlestick Pattern:
Confirmation Signals: Traders often look for confirmation signals to validate whether a reversal is likely to lead to trend continuation. These may include candlestick patterns, chart patterns, and technical indicators that align with the overall trend direction.
Risk Management: Proper risk management is crucial when trading reversals within a trend. Traders should set stop-loss orders to limit potential losses in case the trend doesn’t continue as expected.
Time Frame Consideration: The concept of a reversal to continue a trend can vary based on the time frame traders are using. What appears as a reversal on a shorter time frame may be a minor correction within a more extended trend on a higher time frame.
In conclusion, understanding the hammer candlestick pattern and the dynamics of reversals within trends is essential for forex traders. By combining technical analysis, confirmation signals, and risk management, traders can navigate these patterns and make informed decisions to potentially profit from both reversals and trend continuations in the forex market.